SmartGraphs - African Lions: Modeling Populations
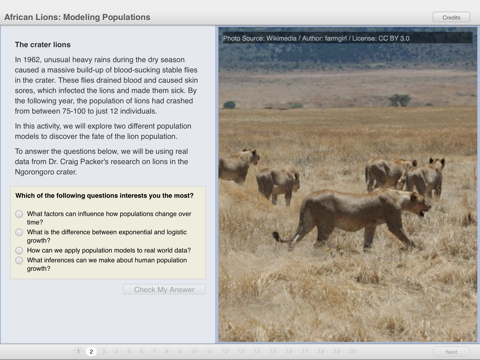
SmartGraphs help students understand graphs. In African Lions, make sense of exponential growth models. Use graphs to discover trends in the growth and decline of a lion population in Tanzania. Compare your predictions to real data – and learn the fate of a special population of big cats.
African Lions was designed for high school and community college students studying biology and ecology.
KEY FEATURES
- Hints guide your work
- Easy-to-use interface
- No third-party advertising
- No in-app purchases
- Free of charge
TEACHER RESOURCES
Lesson plan and student assessment documents are available online. Please see http://short.concord.org/26
For additional science, math and engineering activities, visit us at concord.org, like us on Facebook: facebook.com/concordconsortium and follow us on Twitter: twitter.com/concorddotorg
For more information: concord.org/smartgraphs
This material is based upon work supported by the National Science Foundation under Grant No. DRL-0918522. Any opinions, findings, and conclusions or recommendations expressed in this material are those of the author(s) and do not necessarily reflect the views of the National Science Foundation.


